


Strategic plant selection – free site analysis tool
Outside the borders of your growing site—what's growing in the environment surrounding you?

Last week I shared different ways you can create your own plant guilds to suit your specific needs. It was very specific to centering choices on your own needs and values. However, you can also consider what’s growing in the environment surrounding you. Last year I learned about a valuable free tool called Beescape. The tool is not very mobile-friendly yet, so I recommend exploring it on a desktop. Beescape allows you to analyze flowering plants, pollinator habitat, and land use in 1, 3, and 5-mile radii options (with half-mile interval selections) from an address you enter. The tool also allows you to trace a custom area, so if you’re less interested in a radius perspective, you can trace your own property, or trace a specific area you want to learn more about.
This can help you understand which guilds or plants to prioritize on your own property. For example, if you’re surrounded primarily by forest (like me), you could focus more on establishing different habitats and plants to increase habitat diversity for wildlife.
The tool can also help you compare properties when you’re considering buying land or a home. Perhaps one site has a high pesticide index and another doesn’t. Although the tool is populated with historical data and currently doesn’t forecast future land use, it could help factor into property considerations.
You could also lean on the tool to identify plants to prioritize by bloom time. For example, I have favorable floral resources in spring and summer, but fall is relatively low. I could use that information to prioritize perennial plantings of goldenrod or aster, and succession plantings of buckwheat or sunflowers in the fall to help boost autumn floral options knowing that there’s a deficit surrounding my particular site in that season.
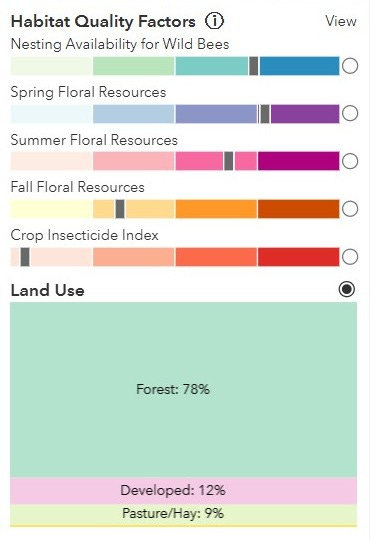
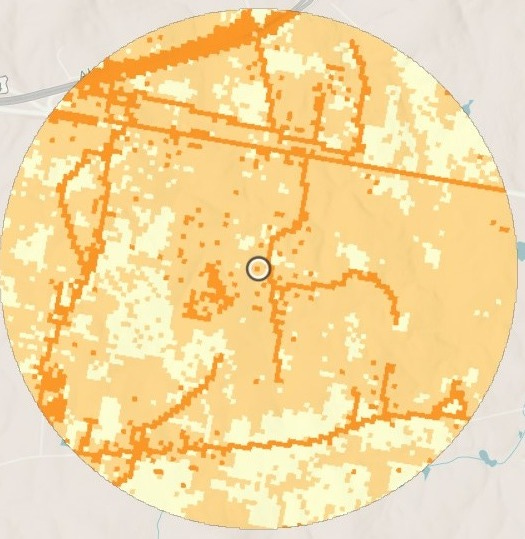
You can drill down and see where the specific floral resources are located. For example, in a 1-mile radius from my primary apiary, I chose the fall floral sources. The deeper the orange shade, the higher density of resources.
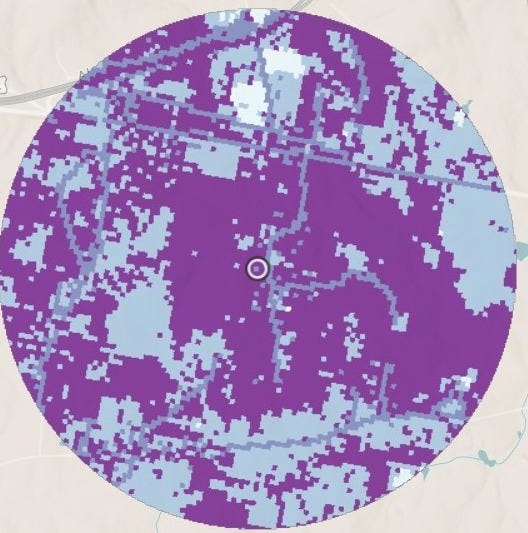
The view of spring shows the site is in the heart of the highest density of floral resources. The deepest shade of purple indicates the highest resources.
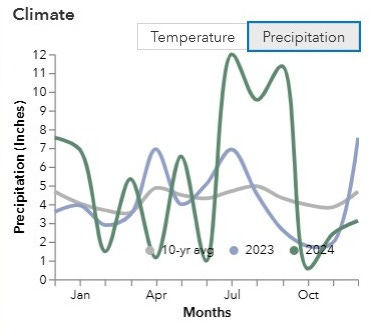
The tool also provides a quick glance at annual temperature and precipitation in the selected area. This can help you decide if you want to add seasonal or year-round water features, and whether you want to select drought-tolerant or heat-tolerant plants.
If you’re creating a permaculture site design, you could easily overlay these projections on your site map and include the factors as part of your site analysis. The tool also allows for analysis of wild bee nesting sites, pollinator economic value estimates, and offers export options for reports.
I have no affiliation with Beescape. It was created by the Penn State University Center for Pollinator Research. Check out their Beescape FAQs to understand more about how they collect and reference data, and how they scale and score sites.
Does the tool surprise you about your own site? Would it change the types of plants you choose to add or remove?