Draw your own permaculture site part 1: Design strategy
Developing your base map will help launch your design strategy.
I want to highlight a few things to help set you up for success. First, you’ll have a deeper design experience if you have access to the site. You don’t need access for this first step, but for the overall design process you’ll reap more benefits if you can visit the site. Part of why I say this is that firsthand observation will influence your design direction. You’ll want to observe different parts of the site at different times of the day, ideally over the course of a year, and through extreme weather events. Second, you don’t need to have previous digital design experience to develop a site plan, although some design background will help accelerate your work. Lastly, your overall permaculture site design isn’t a single map. It’s a comprehensive book detailing soil, weather, flora and fauna, community partners, and so much more. Since this is only a three-part series to help you start to draw your own site, we’re only touching on a few of these areas.
When choosing a way to develop and store your designs, think about your plans for the design. Are these just for you and your personal planning? Are you hoping to share these with a landscape architect or a builder? Are you planning to offer site design services and have paying customers? If you’re just getting started and looking for something free, I recommend using the free tool in Google’s application suite, Google Slides. You could also use PowerPoint. You’ll have the flexibility to paste images, design over them, and define your base map for additional analyses. If you’re already comfortable and set up with a design software, then definitely use what fits your comfort. You’re also welcome to use colored pencils and paper. (I recommend having a printer for this approach so that you can print an aerial shot of your site and trace it to create a base map.)
Designing your base map
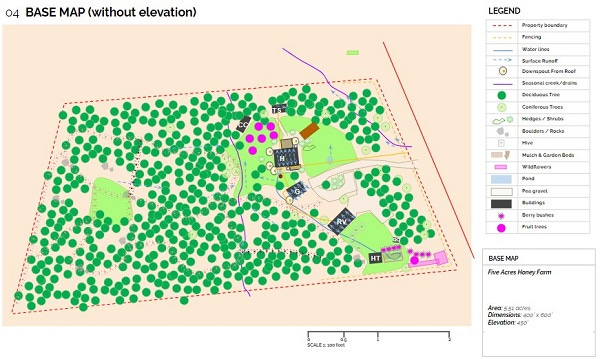
Once you’ve sketched your base map, you can copy and use multiples as templates for your zones, elevation, watershed, solar, existing, and proposed site designs. You can make your site design as sophisticated or as analog as you like. With any approach, you’ll have a deeper understanding of your site’s potential.
When you’re getting started, looking at your site as a whole will help see how specific areas fit together. If you have had a professional survey, that’s a helpful asset to show specific distances and site features.
Your site in relation to everything else
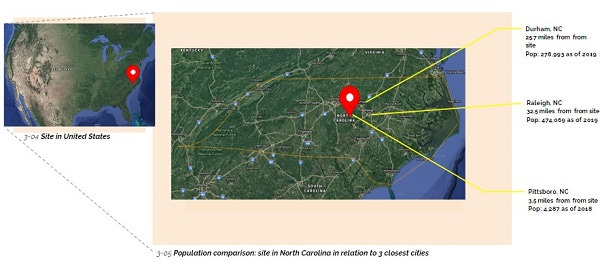
Google Earth will be your friend throughout this design process. Search for your site and start saving aerial shots. Find your latitude and longitude and record that. This initial step in the process is getting you and your site centered.
Before you start sketching your site and identifying boundaries and water features, take a step back and consider where you are in relation to your country, your region, your state or province, your county or municipality, and so on. If you’re using Google Slides, create a few slides showing your site in relation to these perspectives. If you’re using a different design program, create separate artboards or pages for each of these. Add marginal notes about the distance to major cities and water features.
Elevation, features, and structures
If you’re based in the United States, check your county’s real property services for GIS (geographic information system). GIS mapping isn’t available in every part of the US, but most offer free online analyses at the town or county level. If you’re based outside the US, visit GISGeography and ArcGIS Online (currently $100 USD annually for personal use). GIS map services will show you elevations, water features, floodplains, and rudimentary soil data. In some cases, you could use screenshots of the elevation maps to trace elevation lines for your own base map. Lean on these services to create a base map with elevation and a separate one with water features.
Create a legend for structures and simple vegetation. In other detailed sections of your permaculture site design, you can include species inventories, but for your initial designs, lead with a symbol for deciduous trees, another for conifers, and another for fruit-bearing. (When we get to soil in another post or two, you’ll lean on the types of trees to help with soil identification.) For water features, add unique symbols to show water direction. If there are structures on the site, add a symbol for any downspouts on the structures. A helpful legend could include: property boundaries, fences, human-made water lines, natural water runoff, downspouts, creeks, drains, ponds, lakes, trees, shrubs and hedges, berry bushes, boulders and rock features, garden spaces, garden beds, bee hives/apiary, structures (home, shed, barn, etc.), driveways, roads, trails, and road/trail surface types (pea gravel, asphalt, dirt, etc.).

Permaculture Zones
Permaculture zones refer to areas of the site and how frequently they’re used. Many books go into deep detail about zone definitions. For your purposes, use one of your maps to document your current zones. Zones 0 to 2 are used most frequently, and zones 3 to 5 are used less often. Your zone map will look like a wavy bulls-eye with the most frequently used spaces in the center. It’s OK if you have zone “islands” when you get to higher zones—the areas that you don’t access as frequently. Maybe there’s a spot on the site that’s a prime firewood source and you only visit it seasonally to fell trees and cut next season’s firewood. You might have another area that annually flushes with chanterelles and that’s the only time you check it. Those spaces could be in different areas of the site, and would fit into a higher zone, but wouldn’t be connected.
Your design strategy
As you start to compile your base maps you might have some surprises. The biggest surprise for me when creating my initial site designs was that we don’t truly utilize half our property, and it’s very clearly delineated by a seasonal creek. Although seeing that high a ratio of unused space surprised me, it also comes with benefits: We’re conserving that space for wildlife, it’s low-to-no maintenance, and allowing that space to remain “unworked” fosters resiliency. Observing initial site strengths is the first part of what will feed your design strategy. You may have done a SWOT analysis before, but if you haven’t, it stands for Strengths Weaknesses Opportunities and Threats. All of those benefits that I listed are site strengths. What are your site’s weaknesses? Little-to-no utilities where you need them, erosion, heavy tree coverage? Documenting your weaknesses helps identify opportunities. My site map made me realize the 400’ of hose that I run from the house to the garden passes both a detached garage and a car port. Both structures have a combined rooftop footprint of 1000’ sf, which could easily provide an enormous amount of water (which we’ll get to in my post on designing around weather and water) and reduce dependency on the well. What are your site threats? Hurricanes, wildfires, erosion, tree falls, damaging wildlife (ex. deer eating your garden produce)? Look holistically at all of these factors and you’ll start to see your design strategy develop.
The design rests on the details, so document as many as you can. Perhaps seeing ideal garden spaces and having too many trees to support light needs could prompt you to fell trees for firewood, fencing, or building other necessary structures. Each element and action will feed into your strategy.
Permaculture design series and Q&A
Tomorrow’s post is dedicated to everything soil. You’ll learn how to identify soil on your site without even getting your hands dirty.
The September 19 live Q&A Zoom session at 7 p.m. ET is for paid subscribers only. Zoom invite included in the next section.


